Wednesday 30 July 2014

Who wins the Education Debate ?: UMR and Herald-Digi Polls on Quality Teachers vs Class Size


Herald-DigiPoll

The Herald have just released further results from a Herald-DigiPoll (part of their
Mid July political poll), which finds that "New Zealanders would rather money was
spent on improving teaching standards" - ostensibly National's position - "than on reducing class sizes" -  allegedly the core of Labour's policy. (see article here
 http://www.nzherald.co.nz/nz/news/article.cfm?c_id=1&objectid=11297568 )

The Herald-DigiPoll asked respondents: 'Labour has promised to lower class sizes by hiring 2000 more teachers instead of spending $359m National would spend on trying to improve teaching standards. Which of the following best fits your view ? (1) The money
is better spent on cutting class sizes or (2) The money is better spent on trying to improve teaching standards.'

The result:

Cut Class Sizes 34.5%

Improve Teaching Standards 61.3%

Don't Know/Refused 4.2%

Understandably, Labour's education spokesman, Chris Hipkins, has rejected the whole premise of the Poll question, pointing out that a focus on improved teacher training and quality was also a central facet of the policy package announced at the Labour Party Congress a few weeks back. Amongst other features, for instance, Labour announced it would use pre-screening to raise the standard of entry into teaching courses, would establish a comprehensive school advisory service to share best practice and act as mentors and advisors to teachers and would redirect resources currently spent on enforcing National Standards into teacher development programmes.

While The Herald would no doubt argue that the Parties' respective policy platforms needed to be greatly simplified in order to make them more easily comprehensible for poll respondents, there seems little doubt that Herald-Digi have asked a leading question, here (some have described it as push-polling) - framing things in a highly reductive Labour = Smaller Classes / National = Higher Teaching Standards narrative. And the problem goes much further than simply the exclusion of Labour's improved teacher training proposals. As a regular commentator on The Standard Blog has pointed out (  http://thestandard.org.nz/tuwhera-mike-23072014/#comment-853451 ) "What do they think the point of smaller classes is if not higher teaching standards ? Surely higher teaching standards is the desired result of both approaches.... But they're comparing the method on Labour's part with the desired goal on National's".  Some have suggested a more accurate wording of the poll question would have been something along the lines of: Labour and National both say they want to improve the quality of teaching and outcomes for students. Do you prefer Labour's policy of seeking to achieve this by training more teachers in order to reduce class size OR National's policy of seeking to achieve this by financially-rewarding and utilizing executive principals and selected high-performing teachers ?

It's perhaps not all that surprising then that, on the simple and somewhat inaccurate terms in which the debate has been rendered by the MSM, most voters do, indeed, prefer National's strategy.


The Dominion Post Weighs-In

Nor is it surprising when one considers the broader MSM framing of Labour's education policy over recent weeks. Labour leader David Cunliffe announced the policy in a keynote address to the Labour Congress on Sunday July 6. And on the Monday immediately following, my local daily, The Dominion Post, seemed to want to nip any resulting cut-through with voters in the bud with its Front Page headline: Cuts only Half the Story - Educators.

"Labour's proposal to reduce class sizes", Dom Post journalists Michael Forbes and Olivia Wannan assured readers, in what seemed like an explicit, pre-prepared, in-your-face rebuttal, "has failed to win a universal gold star, with experts saying the small cuts without improving teaching would do little to raise the bar of student achievement."

Click on Read More for full Stats and Analysis
Friday 18 July 2014

Santa's Little Helpers: January - July 2014 Poll Results for the Minor Parties


ABOVE: ACT leader Jamie Whyte

A couple of weeks ago, I posted this year's poll results for the four largest Parties - National, Labour, the Greens and NZ First.

A few people have since asked me to do the same for the minor parties. So here are the relevant stats.

Below the main table, as a way of providing a quick, easily digestable, overview, I've set out the averages for the minor parties, along with a very brief written analysis.

I present averages for each of the minor parties for:
(1) all of 2014 up to the present (January to mid-July)
(2) a First Quarter (Jan-March) and Second Quarter (April-mid July) comparison to highlight - in broad terms - who's on the way up, who's flatlining, and who's trending down
(3) Monthly averages (in order to allow a more nuanced view of polling trends)
(4) Each of the five Public Polls (in order to highlight which of the Polls tend to be better or worse for each of the minor parties)


Click on Read More for full stats and analysis

Saturday 12 July 2014

National Mum and Labour Dad: A Few Minor quibbles with Maori Television's Media Take


ABOVE: Media Take presenters Toi Iti and Russell Brown


I've finally got around to watching Maori Television's valuable new series Media Take. Given that I helped kick-off the recent social media debate on the Undecideds (albeit with a relatively brief analysis), I was particularly interested to see Russell Brown's interview with Colmar-Brunton's Andrew Robertson and UMR's Gavin White. I'll be dealing with the issue of Undecideds in a later post, but at this stage I just want to correct one or two minor points on other matters.


First
In the opening sequence of the final segment on opinion polls, Brown suggests that "Until 1971 the only way to tell how New Zealanders might vote was to go out and ask them personally. Or to wait until we'd actually voted. We were late to political polling."

Well, yeah, compared to the US, the UK and even Australia we certainly were late.....but not quite that late. In fact, the first bona fide, nationwide pre-Election poll was carried out as early as 1960. In that year, a polling company calling itself Gallup New Zealand (not, apparently, a subsidiary of the famous American Gallup Poll organisation) carried out its first pre-election poll. Gallup New Zealand employed the (now) old-fashioned quota method, with interviewers fanning out into city streets and elsewhere with the aim of  finding a representative sample by filling quotas for various demographics in the same proportion found in the census.

Click on Read more for rest of analysis

Thursday 10 July 2014

Overview: 2014 Poll Results (January - August)


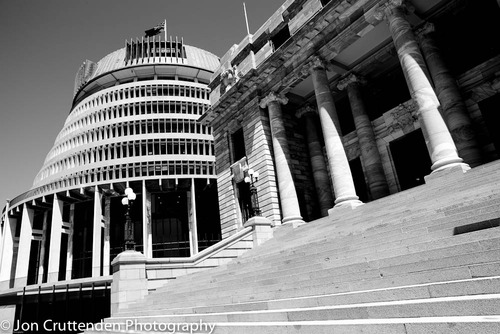
The Beehive 2, Wellington, New Zealand


I'm currently completing a detailed Two-Part Post analysing Opinion poll trends over the last few years. Specifically, Part One will take a close look at the disparities between
(1) Poll support for each party in the 18-month run-up to the last two Elections and (2) the proportion of the party vote they actually received at the subsequent Election (with a focus on explaining why both National and the Right Bloc fell so heavily. In the process, I'll analyse the various arguments put forward to explain the trend, in particular taking issue with two theses advocated by the Right).

Part Two will build on that analysis by providing an overview of polling trends over the last 18 months and then applying the lessons from 2008 and 2011 (ie from Part One) in order to get to grips with where we are now in early-mid July 2014.

Both are currently in draft form. Half-way through each (also part-way through a more detailed follow-up to the brief analysis of Preferred PM figures in my Follow the Leader Post below).

For now, though, here are the results from every Poll of 2014, January - June:
(and, as you can see, I still haven't learnt how to produce properly-constructed tables on blogger. So it's my usual low-tech, free-hand approach)


2014 Opinion Poll Results
(Note: Due to rounding, the L+G figure may sometimes be one point above or below the combined Labour and Green figures. If, for example, Labour were on 31.6% in a particular poll and the Greens on 10.7%, they would be rounded up to 32% and 11% respectively. Combined, that would equal 43%. And yet, 31.6 + 10.7 = 42.3%. So, the actual L+G figure would, in this case, be rounded down to 42%)
------------------------------------------------------------------------
                             Lab     Green    L+G        Nat      NZF
-----------------------------------------------------------------------
January

Roy Morgan
Mid January.................34%...........13%............46%............44%...........4%

3 News Reid Research
Late January................34%...........12%............46%.............45%...........6%

Roy Morgan
Late January................33%...........11%............44%.............47%...........5%

----------------------------------------------------------------------
February           Lab     Green     L+G         Nat       NZF 

Fairfax-Ipsos
Early February............32%...........10%............42%..............49%...........4%

Roy Morgan
Early February............30%............12%...........42%...............48%..........6%

One News Colmar-Brunton
Mid February..............34%.............8%.............42%...............51%...........3%

Roy Morgan
Late February.............31%.............11%............41%...............49%...........5%

------------------------------------------------------------------------
March               Lab       Green     L+G         Nat       NZF

Herald-DigiPoll
Early March...............30%..............13%............43%................51%..............4%

Roy Morgan
Early March...............32%..............14%.............46%.................46%.............4%

One News Colmar-Brunton
Late March................31%...............11%.............42%.................47%.............7%

3 News Reid Research
Late March................31%................11%............42%..................46%............5%

Roy Morgan
Late March................32%................13%.............45%..................43%.............6%

------------------------------------------------------------------------------
April                Lab         Green       L+G            Nat        NZF

Roy Morgan
Early April................29%.................12%..............40%...................49%..............6%

Roy Morgan
Late April..................31%.................15%...............46%..................43%..............6%

-------------------------------------------------------------------------------
May                  Lab          Green        L+G            Nat      NZF

Fairfax-Ipsos
Early May.................30%....................13%...............42%..................48%...........4%

Roy Morgan
Mid May...................31%....................14%................44%.................46%...........6%

One News Colmar-Brunton
Mid May....................30%....................11%...............41%..................51%.............5%

3 News Reid Research
Mid May....................30%.....................10%................40%...............50%.............6%

Roy Morgan
Late May...................29%.......................9%.................38%...............53%.............5%

-------------------------------------------------------------------------------
June                   Lab           Green        L+G        Nat        NZF

Roy Morgan
Early June...................28%....................12%................40%..............50%............4%

Herald-DigiPoll
Early June...................31%.....................11%................41%..............50%............4%

Fairfax-Ipsos
Mid June......................23%.....................12%................35%..............57%............3%

3 News Reid Research
Late June.....................27%.....................13%..................40%.............50%.............4%

One News Colmar-Brunton
Late June.....................29%.....................12%...................41%..............50%............4%

Roy Morgan
Late June.....................28%......................12%..................40%..............48%............6%
--------------------------------------------------------------------------------------
July                     Lab            Green         L+G         Nat        NZF

Roy Morgan
Early July......................24%....................15%...................39%..............51%.............6%

Fairfax-Ipsos
Early July......................25%....................12%....................37%..............55%..............3%

Herald-DigiPoll
Mid July.........................27%....................10%....................36%...............55%..............5%

3 News Reid Research
Mid July.........................27%....................12%....................39%...............49%..............4%

One News Colmar-Brunton
Mid July.........................28%.....................10%....................38%...............52%..............4%

Roy Morgan
Late July.........................30%.....................12%....................42%...............46%..............5%

------------------------------------------------------------------------------------
August                  Lab           Green          L+G           Nat       NZF

Fairfax-Ipsos
Early August.....................23%...................11%...................34%.................55%.............3%

3 News Reid Research
Early August.....................29%...................13%...................42%..................48%............5%

One News Colmar-Brunton
Early August.....................26%....................11%..................37%..................50%.............5%

Roy Morgan
Early August.....................28%....................12%..................39%..................48%.............7%

Herald-DigiPoll
Mid August........................25%....................14%..................39%..................50%.............4%

3 News Reid Research
Late August........................26%....................14%..................40%..................45%.............6%

Herald-DigiPoll
Late August........................24%....................11%..................36%..................51%.............5%

Fairfax-Ipsos  
Late August........................26%....................12%..................38%...................51%............4%

One News Colmar-Brunton
Late August........................28%....................12%...................40%...................48%............6%

Roy Morgan
Late August.........................26%...................16%....................42%..................45%............6%

3 News Reid Research
Late August.........................26%...................13%....................39%..................46%............6%

-----------------------------------------------------------------------------------------
September

Fairfax-Ipsos
Early September...................24%...................13%....................37%..................54%...........4%

Herald-DigiPoll
Early September...................24%...................11%....................35%..................50%...........6%

One News Colmar-Brunton
Early September...................26%...................11%....................37%..................50%...........7%


3 News Reid Research
Early September...................26%....................13%...................39%..................47%...........6%

One News Colmar-Brunton
Early September...................25%....................14%...................39%..................46%............7%

Herald-DigiPoll
Early September...................25%....................12%....................36%..................49%...........8%


Monday 7 July 2014

Blackadder as it Might Have Been: A Pilot Episode


Recently found this rather strange (1982) pilot for the first series of Blackadder (which was eventually produced in 1983 as The Black Adder).

The script and plot are essentially the same as the first series episode, Born to be King, although bits and pieces from the pilot were deleted (clearly for the better). And the pilot is vaguely set in late 16th Century Elizabethan England rather than the late-15th Century Battle of Bosworth Field era (First Series).

But by far the most interesting thing is the casting and characterisation of the pilot.  Rowan Atkinson (Prince Edmund / The Black Adder), Tim McInnerny (Lord Percy Percy), and Alex Norton (McAngus) are all there in the pilot. So is Elspet Gray (although she plays a very aristocratic English Queen in the pilot rather than  Gertrude of Flanders - "just a little Dutch Girl" as she describes herself in Born to be King).

Baldrick, though, is played by some bloke named Philip Fox (and I have to say he doesn't come close to Tony Robinson's characterisation), The King is played by veteran actor John Savident (who later went on to become Fred Elliott in Coronation Street) as a fairly tired, irritable, somewhat pompous Upper Class character rather than the wild and boisterous Series One version played by Brian Blessed, and Cold Feet's Robert Bathurst was cast as Prince Harry in the pilot, with the role ultimately going to Robert East.

What's more, Atkinson plays The Black Adder as a shrewd and scheming character much closer in temperament to the Blackadders of the later series (and more than a wee bit like some of his Not the Nine O'Clock News personas from just a year or two earlier). Eventually, of course, he was to play Prince Edmund  in the commissioned first series as an equally ambitious but much more weasly, clueless and inept character.

I suppose it's normal for pilots, but the low production values and odd casting are fairly apparent. Here's the pilot in 3 parts...


Part 1 .... https://www.youtube.com/watch?v=a5NWNHS3eM4


Part 2 .... https://www.youtube.com/watch?v=Cmxc0tQaLeE


Part 3 .... https://www.youtube.com/watch?v=_y3S3oynje4


And just for comparison, here's a scene from the Born to be King episode that the pilot inspired. Looks much more professional...

Born to be King (Edmund's Duel with McAngus) .... https://www.youtube.com/watch?v=Sz1A7Xaz-rk


Thursday 3 July 2014

Follow the Leader: Fairfax-Ipsos Preferred PM Breakdowns


 John Key, David Cunliffe and Russell Norman (Getty Images)


Fairfax have recently made their Preferred PM (by Party Support) demographics available. The methodology underpinning the Preferred PM measure in the four Public Polls that ask this question (Fairfax-Ipsos, Herald-DigiPoll, One News Colmar Brunton, 3 News Reid Research) tends to be shrouded in ambiguity, leading, in turn, to widespread misinterpretation. I'll try to clarify things in my next post. For now, though, here are the Feb/May/June 2014 Fairfax-Ipsos breakdowns.


Fairfax-Ipsos 2014

Preferred Prime Minister by Party Support
 

 National  Supporters 

Key.....................June 94%................May 96%................Feb 95%
Cunliffe...............June 0%.................May 0%..................Feb 0%
Peters.................June 0%..................May 1%..................Feb 0%
Norman..............June 0%..................May 0%..................Feb 0%
Turei...................June 0%..................May 0%..................Feb 0%
Other..................June 2%..................May 1%...................Feb 1%
Not Sure.............June 5%..................May 3%...................Feb 4%


 Labour  Supporters  

Key.....................June 6%.................May 8%................Feb 7%
Cunliffe..............June 42%...............May 38%..............Feb 50%
Peters..................June 2%.................May 4%................Feb 3%
Norman...............June 2%.................May 2%................Feb 1%
Turei....................June 0%.................May 0%................Feb 0%
Other...................June 11%................May 7%................Feb 7%
Not Sure..............June 37%................May 42%..............Feb 33%


 Green  Supporters 

Key.......................June 6%..................May 6%................Feb 12%
Cunliffe................June 17%................May 33%..............Feb 36%
Peters....................June 1%..................May 1%................Feb 0%
Norman................June 23%...............May 12%................Feb 16%
Turei....................June  4%.................May 3%..................Feb 9%
Other...................June 11%................May 14%................Feb 6%
Not Sure...............June 39%...............May 31%................Feb 21%


 NZ First  Supporters 

Key......................June 17%..................May 20%..................Feb 24%
Cunliffe...............June 15%..................May 9%....................Feb 6%
Peters..................June 47%..................May 46%..................Feb 58%
Norman..............June 0%....................May 0%....................Feb 0%
Turei..................June 0%.....................May 0%....................Feb 0%
Other.................June 0%......................May 4%....................Feb 3%
Not Sure............June 22%....................May 22%..................Feb 9%


A number of factors appear to stand out:

- National supporters overwhelmingly prefer Key (over 90%)

- Labour supporters prefer Cunliffe first and foremost (currently 42%), but "Not Sure" comes a close second (37%), with very few going for Key (6%)

- Green voters also express a high "Not Sure" response (39%), followed by Norman (23%) and Cunliffe (17%). Like Labour supporters, the Greens show little enthusiasm for Key (6% - only half his February rating)

- Despite talk of "The Peters Party", less than half of NZ First supporters in fact prefer Peters as PM, with the rest relatively evenly divided between Key, Cunliffe and Not Sure

- Cunliffe clearly took a hit among Labour supporters following the Trust Donations controversy (May 38%, compared to February 50%), with most of this 12% moving into "Not Sure" territory. He has since bounced back to some degree

- Green supporters have swung away from Cunliffe (down 19 points since February) and towards both Norman and, in particular, the "Not Sure" category (the latter up 17 points since February)

- Among NZ First voters, both Peters' and Key's  Preferred PM ratings have declined (down 11 points and 7 points since February respectively), while Cunliffe and "Not Sure" have moved up (+ 8 and + 13)

[A word of caution, though: We need to take into account the fluctuations in Party Support. As an Illustrative Example: The Greens' Party Support declined slightly in the Fairfax-Ipsos June Poll (relative to their rating in May). Theoretically, it's possible that those swinging away from the Greens were disproportionately Cunliffe supporters on the Preferred PM question, thus accounting for part (or, indeed, all) of Cunliffe's decline among Green supporters.That's only a possibility, but it's an illustrative example of why you can't necessarily take February-June swings in Preferred PM ratings at face value]